CATEGORY > Customer Churn
Can a 1% reduction in churn result in a 38% increase in ARR?
I gave you the plot of the article in the title. If this intrigues, you then let’s take a deep dive. It will only take 6 mins. Promise.
When I started working on my Customer Success startup ZapScale my first thought was why should anyone spend on Customer Success and what value it brings.
I wanted the answer to the following question.
“What impact does 1% churn have on a business?”
The first thing I did was went on the internet and found some interesting works but none of them had covered the B2B SaaS space in a way that is simple to understand. Please message me if I have missed reading some amazing works.
So, I started to create a model to understand the impact.
Let’s get on the same page and just revise some definitions and benchmarks before we begin.
How to calculate Churn?
Customer Churn
No of customers lost in a month / No of customers at the beginning of the month
For Example:
Customers at the beginning of the month =42
Customers lost in a month =3
Customer Churn = 3/42 = 7.1%
Gross Revenue (Dollar) Churn
(Revenue lost to churn in the month + Revenue lost to downgrade in the month ) / Revenue at the beginning of the month
For example:
Revenue in the beginning of the month = 42* $1000 = $42000
Revenue lost to churn in the month = 3* $1000 = $3000
Revenue lost to downgrade in the month ( 1 customer downgraded to $500) = $500
Gross Revenue ( Dollar) Churn =( $3000+$500) / $42000 = 8.3%
Net Revenue (Dollar) Churn
(Revenue lost to churn in the month + Revenue lost to downgrade in the month – Revenue gained in the month to upgrades) / Revenue at the beginning of the month.
For example:
Revenue in the beginning of the month = 42* $1000 = $42000
Revenue lost to churn in the month = 3* $1000 = $3000
Revenue lost to downgrade in the month ( 1 customer downgraded to $500) = $500
Revenue gained from upgrades (2 customers upgraded to $1500)= 2*$500=$1000
Net Revenue ( Dollar) Churn =( $3000+$500 -$1000 ) / $42000 = 5.9%
The same can be calculated for a quarter, year, or any other time period.
Whenever someone states a churn number it should be qualified with
- Type of Churn (Customer churn, logo churn, Gross revenue churn, or net revenue churn)
- Time period (monthly churn, annual churn)
Churn and retention are just two sides of the same coin. A 2% churn means a 98% retention, but this is a discussion for another article.
What are the current B2B SaaS churn rates?
A. For Customer and Gross Revenue Churn

B. For Net Revenue Churn

In simple terms, negative net revenue churn means your revenue gained by upsells is higher than the loss you incur by losing revenue from downgrades and churn in any time period.
There are various studies and reports that cover benchmarks for churn but most of them put churn numbers between 1% to 24% annual churn.
The churn benchmarks can vary in many parameters based on:
- Business Growth Stage
- Company Age (Mature businesses have better processes and lower churn)
- Price of the product (High priced products have lower churn)
- The complexity of the product (Users are reluctant to change complex products)
- The size of business you target (SME and SMB customers see higher churn than mid-market and enterprise customers)
- Contract duration (longer contract duration shows lower churn)
- Business Vertical or Sector (Some business verticals have higher churn than others)
So what should you do? Just focus on making incremental changes to your numbers. Target on reaching a -ve net revenue churn.

Back to our question. “What impact does 1% churn have on a business?“
We also conducted a 40-minute webinar where I dive deeper into the topic for a detailed discussion. You can watch it here 👇
To understand the above I set up a model to compare the 2 companies.
Both companies are very similar in their business and are at $0.5 Million ARR currently. To simplify I have assumed that both have no downgrade or upsell plans.
Let’s look at the model.
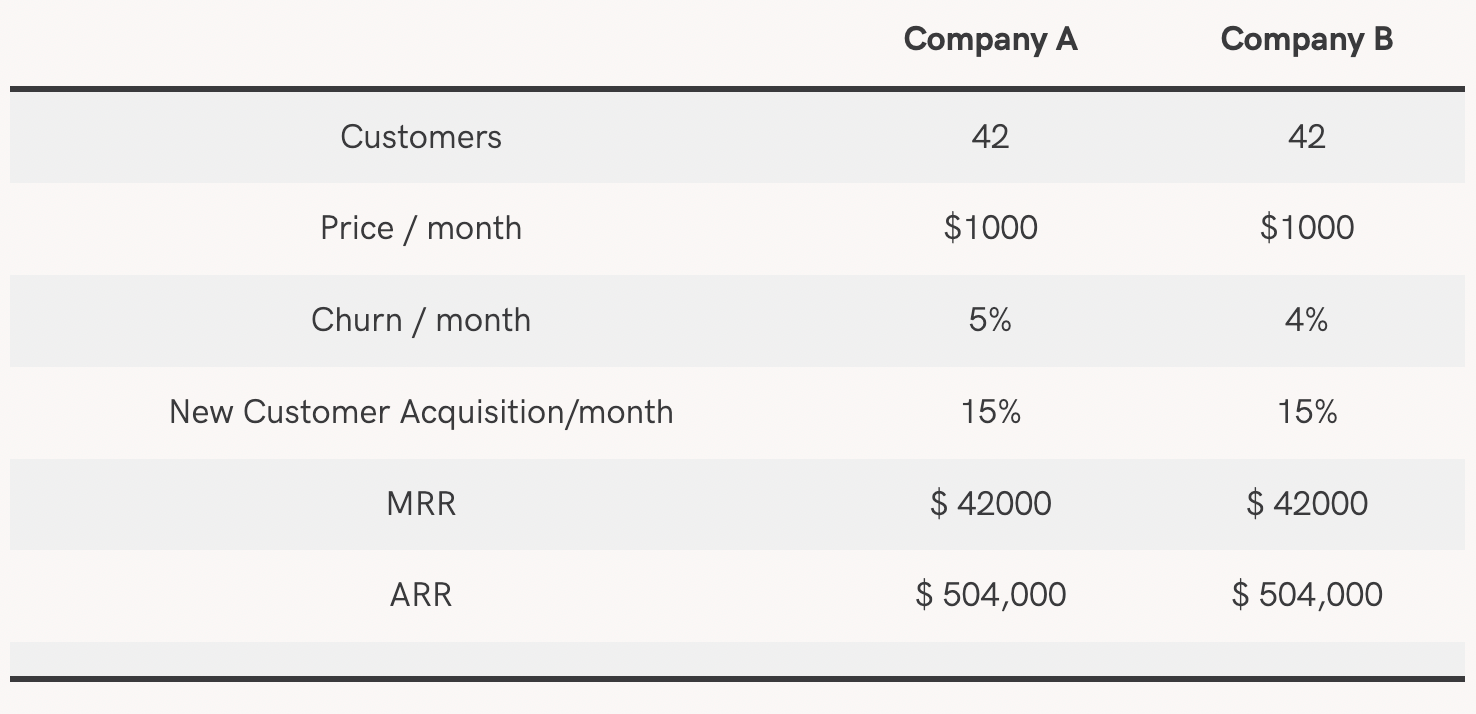
All other parameters of business are the same.
The only difference here is one company has a churn rate of 5% monthly and the other has a churn rate of 4%.
When we model these numbers over a 1 year period.
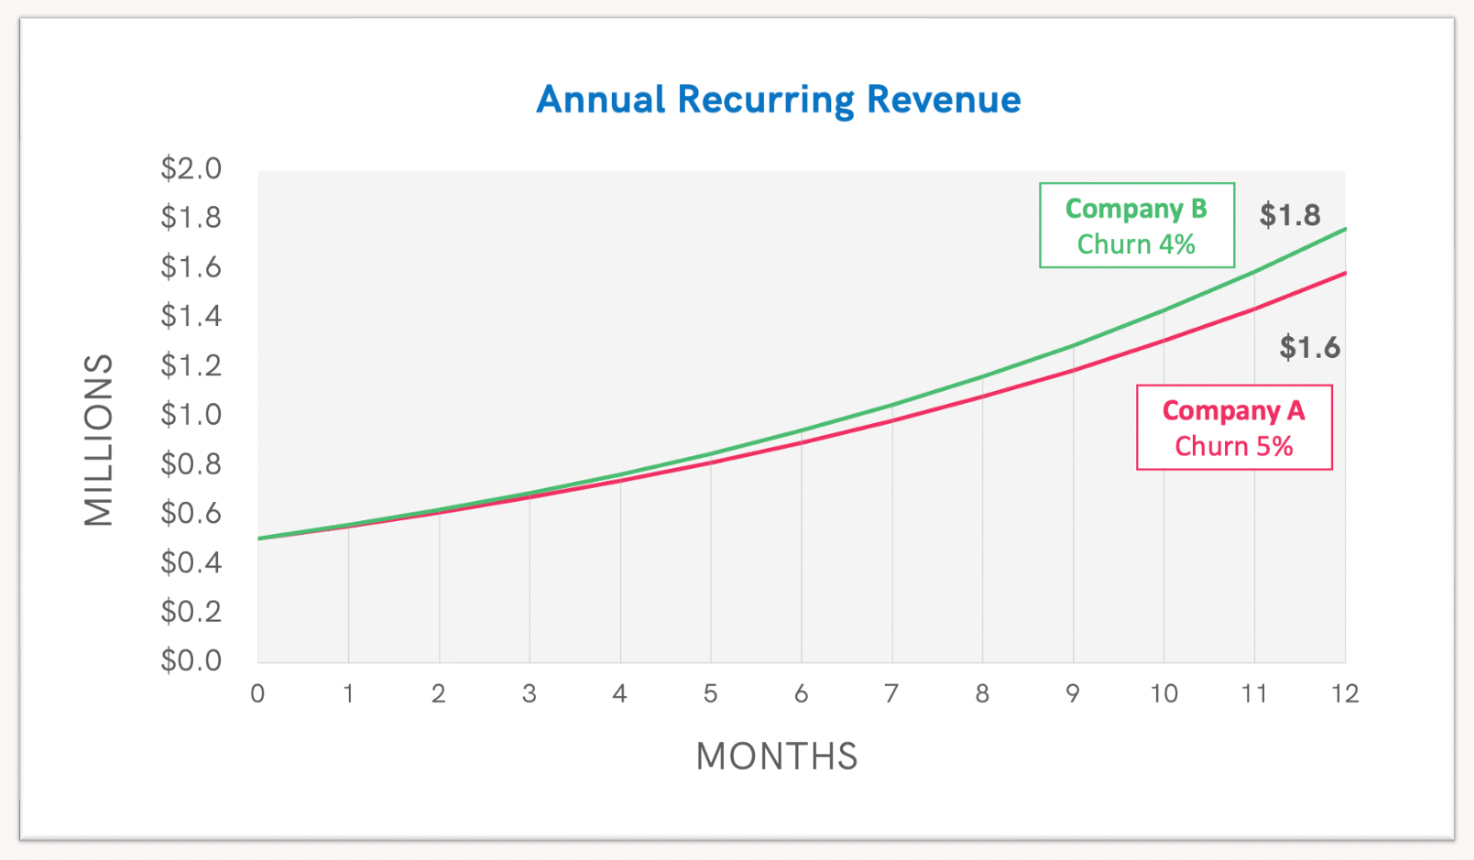
The difference between Company A and Company B in ARR is 11% by the end of year 1.
As the valuation of a SaaS company is generally a multiple of ARR say 10X so company A would be valued 11% lesser than company B by the end of Year 1.
Every 1% change adds 11% to the ARR.
To review the long-term impact, I drew the same numbers for a 3-year period.
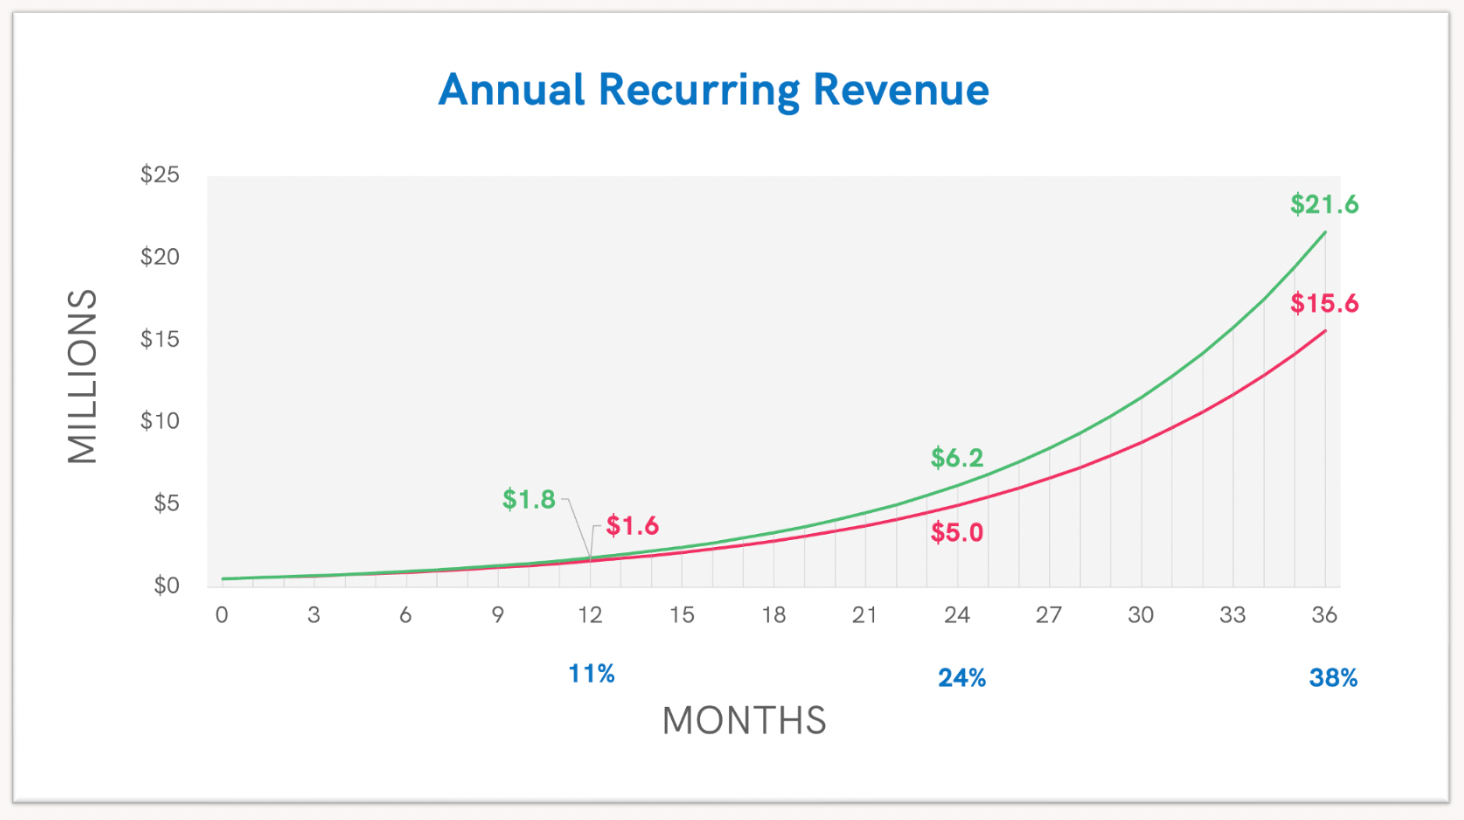
The difference grew exponentially over time.
A 1% change in Churn could mean a 38% difference in ARR over a 3-year period.
This also meant a 38% difference in your valuation at a 10X multiple.
So Company A would be valued at $150M and Company B will be valued at $210M.
This could mean the difference between a good company and a great company.
I would love to have a 38% bump on my ARR and valuation in 3 years in my business.
So when you are budgeting to spend on Customer Success think about the long terms impact a mere 1% or 0.5% increase can have in the longer term.
You can use the excel model to put your numbers and work out what value you could achieve.
Some interesting references:
1. An HBR Paper published in 1990 by Frederick Reichheld of Bain & Company (the inventor of the net promoter score) and Earl Sasser of the Harvard Business School. “Zero Defections: Quality comes to service”. This article states that increasing customer retention rates by only 5% increases profits by 25% to 95%. This research was focused on service companies like credit card, industrial laundry, auto services, and others.
2. There is another insightful HBR Paper by Amy Gallo published in 2014 “The value of keeping the right customers”.
3. Research done by Salithuru published in 2018 states that “Retailers and publishers that increased their spending on retention in the last 1-3 years had a near 200% higher likelihood of increasing their market share in the last year over those spending more on acquisition [of new customers].” This is a global study of 300 CEOs and media and retail executives.
4. Another interesting article published in 2017 by Josh Chapman in TopTal “The Importance of Customer Retention — An Empirical Study” attempts to create a B2B model and understand the impact of retention.
ABOUT THE AUTHOR
Popular from Customer Churn
Quality Content,
Straight To Your Inbox!
Subscribe for the latest blogs, podcasts, webinars, and events!

Write a Blog
If you have experience in CS and
a flair for writing, we’d love to
feature you.
Write to us on
hello@zapscale.com

