CATEGORY > Artificial Intelligence
How ZapScale Uses AI to Calculate Customer Health and Predict Churn
Did you know that ZapScale can predict customer churn for B2B SaaS companies with 94% accuracy? In this article, I’ll break it down in simple terms, but first, let’s discuss the foundation of our artificial intelligence-driven churn prediction model - our unique customer health score framework.
Introduction
Customer health is a comprehensive indicator of your relationship with your customers. It includes various elements such as product engagement, support interactions, financial transactions, and much more. Since there are various elements involved, it becomes imperative that you calculate your customer health score carefully and with precision. The more robust your customer health score framework is, the more clearly you’re able to identify customer pain points and proactively reach out to them with solutions before they even voice their discomfort.
With this, you improve your customer experience, reduce the chances of churn, and improve the upsell opportunities. As a result, your net revenue retention (NRR) grows at a healthy rate, reducing the dependency on new customer acquisition for growth.
“The more your revenue is being retained and expanded from existing customers, the better it is for the organic and sustainable growth of your organization.”
So, back to calculating customer health - is it really crucial for SaaS businesses to track it? Definitely, without a doubt.
While building ZapScale, our #1 priority was to provide SaaS businesses with a health score framework that captures every touchpoint, every pulse of their customers. We wanted to provide them with a health score that is evidence-based, conjecture-free, and accurate. And hence, we developed a sophisticated approach to calculating customer health scores.
Let me try to explain to you in the simplest language how ZapScale determines customer health and consequently gives the most accurate churn prediction so that you’re always ready with the tools you need to run a successful business.
How Does ZapScale Calculate Customer Health?
At ZapScale, we calculate customer health using 150 data points from 6 sources to provide detailed insights into each customer. We evaluate all the possible customer-related metrics that reflect customer engagement and satisfaction to deliver accurate insights into each customer’s overall well-being. Let’s go into a little bit of detail:
Parameters For ZapScale's Customer Health Score Calculation
The overall health score that you see on ZapScale's customer success platform is termed as a ZapScore. It is calculated using a weighted average of several key metrics:
- Product usage score
- Ticketing score
- Feature request score
- Billing and subscription score
- Communication score
- CS Gut feel score
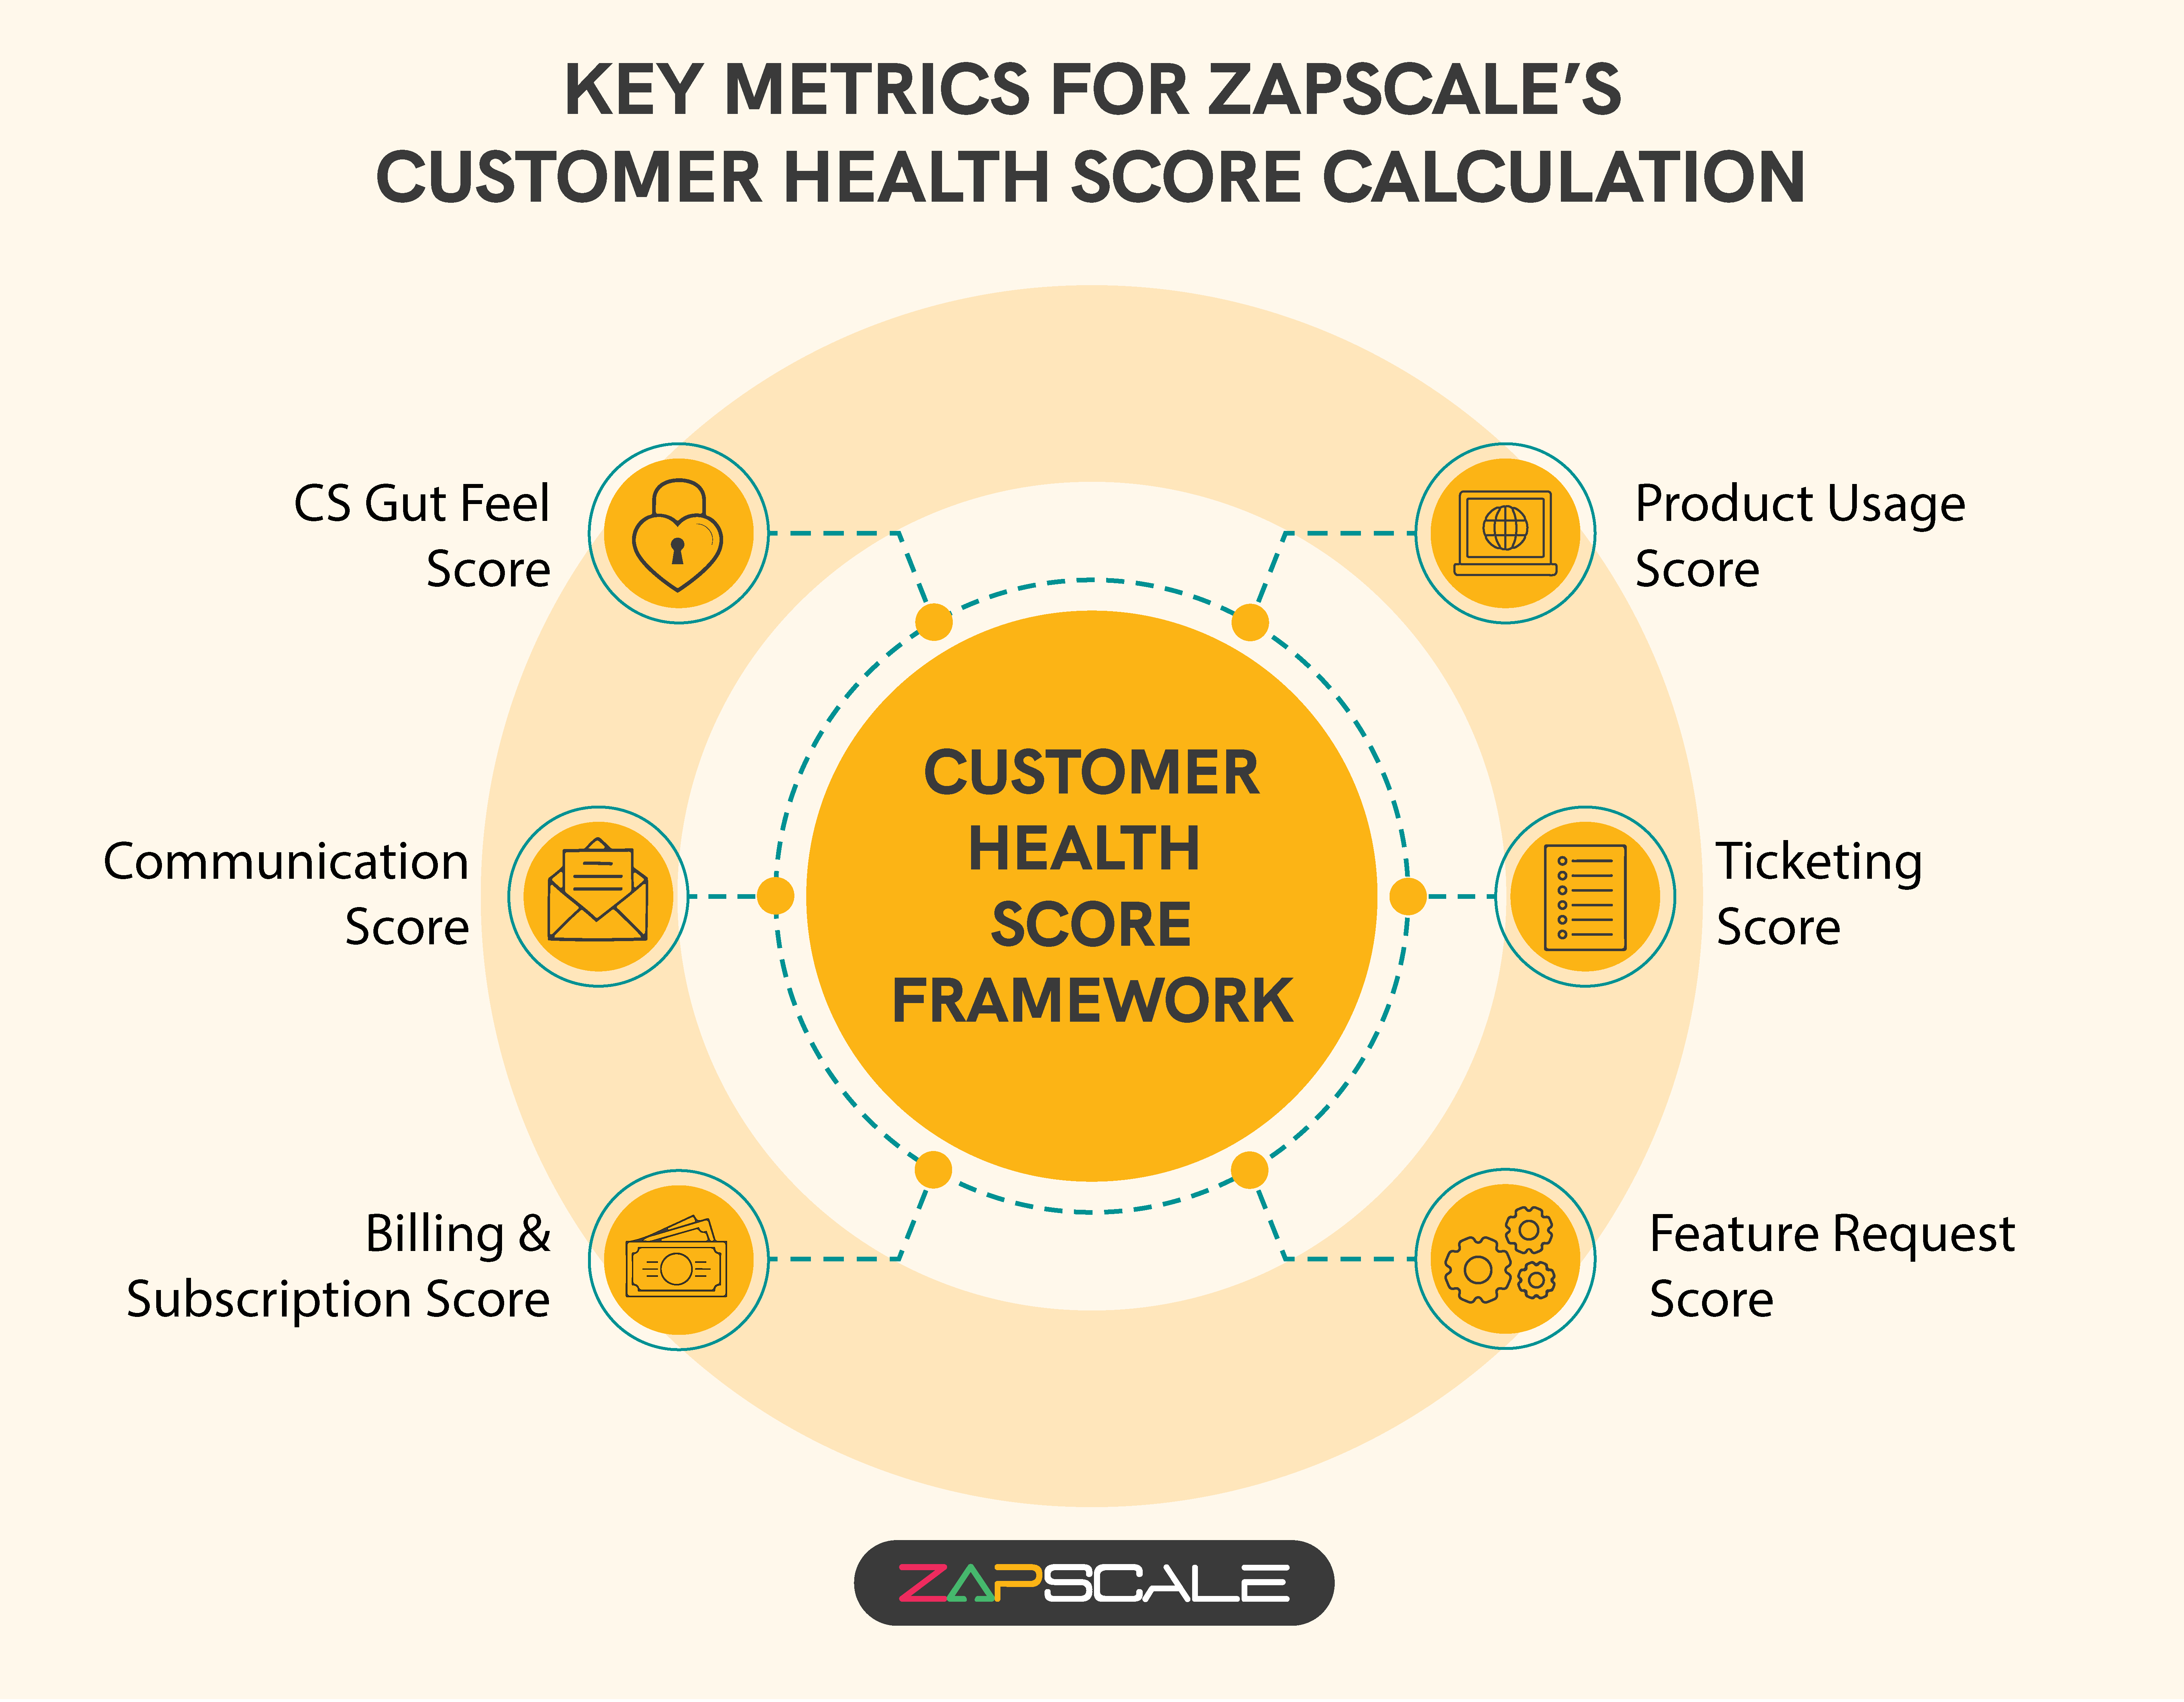
The higher these scores are, the better it is for your business. Once we gather these health scores for all customers, we convert them into a percentile value that presents the data on a 0-100 scale, making it easier for you to assess relative performance.
Let’s go into a bit more detail and talk about these individual scores:
1. Product Usage Score
The product usage score is crucial because it directly indicates how much customers are interacting/engaging with your product and can help identify potential issues and opportunities for improvement. This score is derived from the weighted average of various product engagement metrics, including:
1.A. Pages Visited
Pages visited on the product by the users (Higher is better)
1.B. Feature Usage
Features utilized by users (Higher is better), and
1.C. Time On Product
Time spent on the product by the users (Higher is better)
1.D. Additional KPIs
Any additional KPIs tailored to your product adoption strategy
2. Ticketing Score
The Ticketing Score highlights the volume and resolution of customer support issues and provides valuable insights into customer satisfaction. The score reflects the efficiency of customer support through metrics such as:
2.A. Tickets Logged
Total number of open tickets in the last 30 days (Lower is better)
2.B. Tickets Resolved
Percentage of resolved tickets in the last 30 days (Higher is better)
2.B. Ticket Priority Score
Percentage of “Priority 1” tickets (Lower is better)
2.D. Users Logging Tickets
Percentage of users logging tickets in the last 30 days (Lower is better)
3. Feature Request Score
Feature Request Score reflects customer feedback on the desired product enhancements, enabling your team to prioritize developments within your product that can significantly improve user satisfaction. This score considers:
3.A. Feature Requests Logged
Total number of open feature requests in the last 90 days (Lower is better)
3.B. Feature Requests Resolved
Percentage of resolved feature requests in the last 90 days (Higher is better)
4. Billing And Subscription Score
This tracks the payment behavior of your customers and provides insights into customer’s financial health and loyalty which can even help identify potential churn risks. To gauge the financial health, we track:
4.A. On-Time Payment
Percentage of invoices paid in full and on time in the last 365 days (Higher is better)
4.B. Dues Cleared
Percentage of overdue amounts in the last 365 days (Lower is better)
4.C. Bad Debt
Percentage of invoices unpaid for over 90 days (Lower is better)
5. Communication Score
The Communication Score measures the responsiveness of interactions between you and your customers and can offer valuable insights into the level of engagement. The key metrics include: -
5.A. Communication Frequency
Number of emails or chats sent by the customer in the last 30 days (Higher is better)
5.B. Out Of Communication
Days since the customer last communicated with you (Lower is better).
6. CS Gutfeel Score
The customer success gutfeel Score is the intuitive assessment of the CS team regarding customer health and can help you assess your relationship with your customers. (Higher is better).
Together, these individual scores - Product Usage, Ticketing, Feature Request, Billing and Subscription, Communication, and CS Gutfeel form a 360-degree view of your customer health.
How Does ZapScale Predict Churn With A 94% Accuracy?
To give you a deeper insight into customer health, ZapScale leverages a unique AI-driven approach to pinpoint which customers might be at risk of churning. ZapScale uses an ARIMA model to predict customer churn.
What is an ARIMA Model?
ARIMA, short for Autoregressive Integrated Moving Average, is a statistical modeling tool that is widely used for time series forecasting. ARIMA analyzes patterns in time series data and makes it possible to predict future trends. It is particularly useful in AI applications that require forecasting based on historical data.
One of the most common applications of the ARIMA model is in the healthcare industry. ARIMA models are used to monitor and predict health indicators and assess the health of patients with severe conditions to predict their mortality.
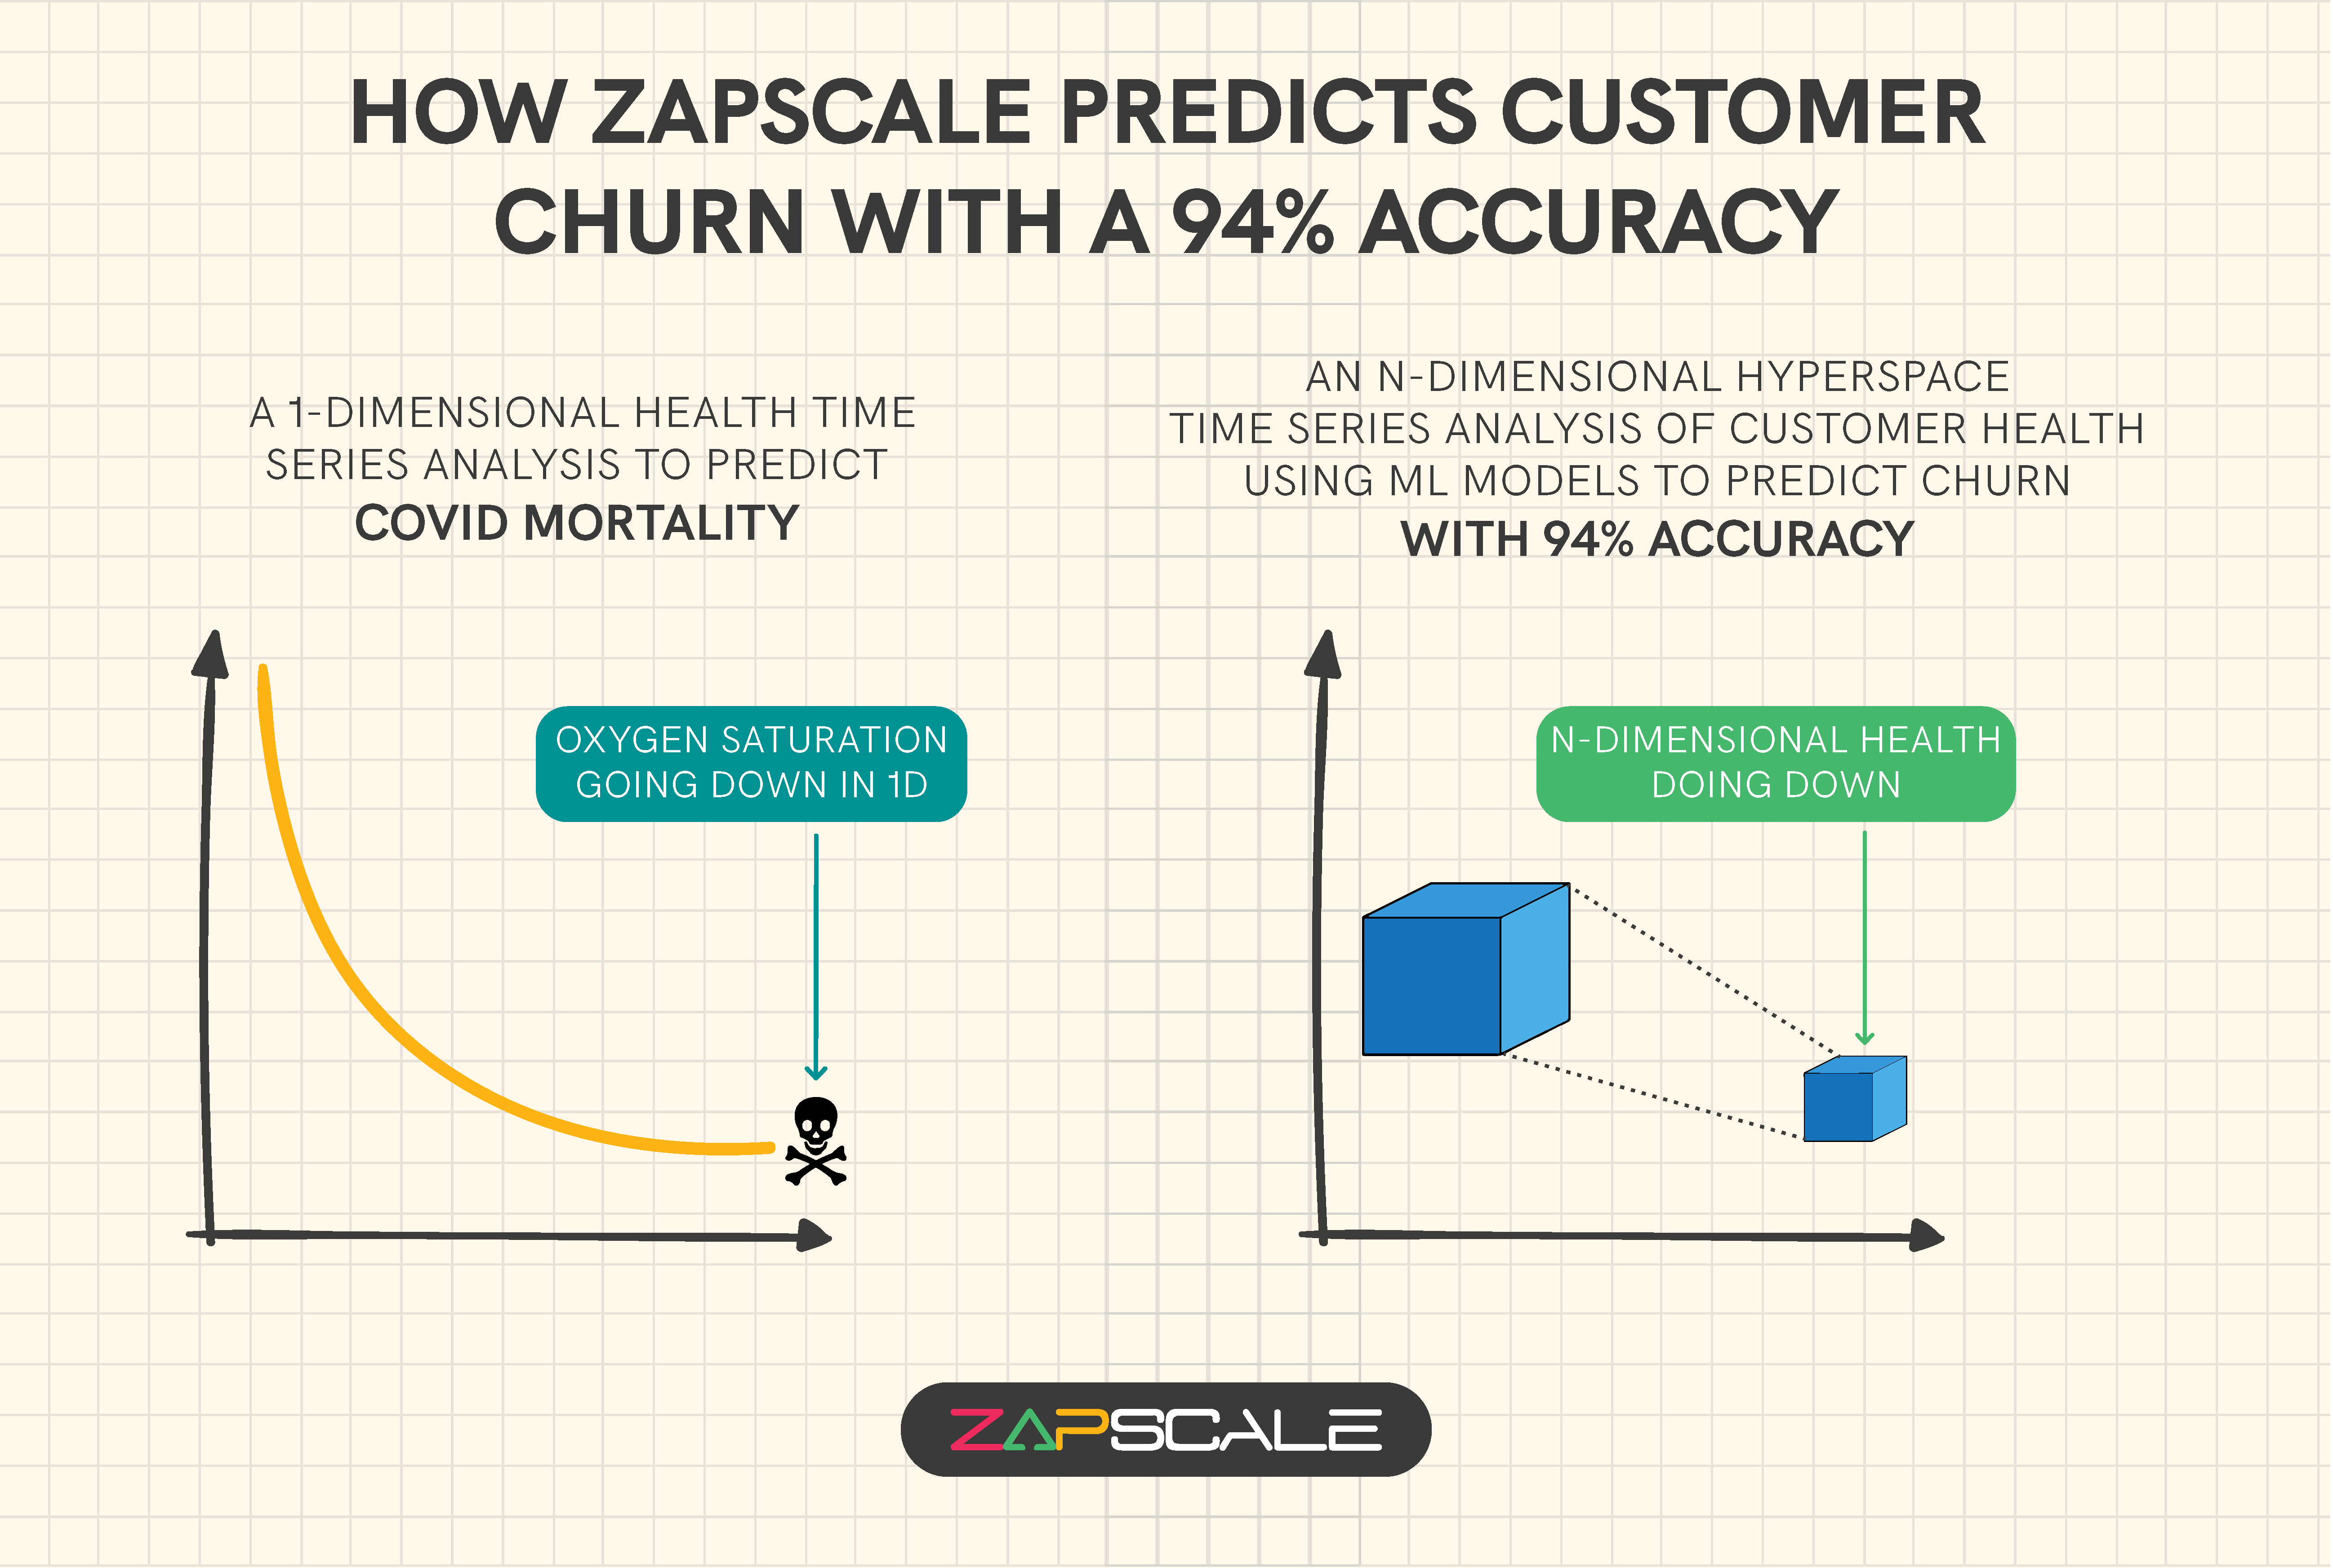
Let me explain to you with the help of an example: Imagine, we are looking at patients who are admitted to a hospital for COVID-19 (sorry for taking a morbid example). How do doctors predict patient mortality?
This is the graphical view of possible patient mortality with COVID-19.
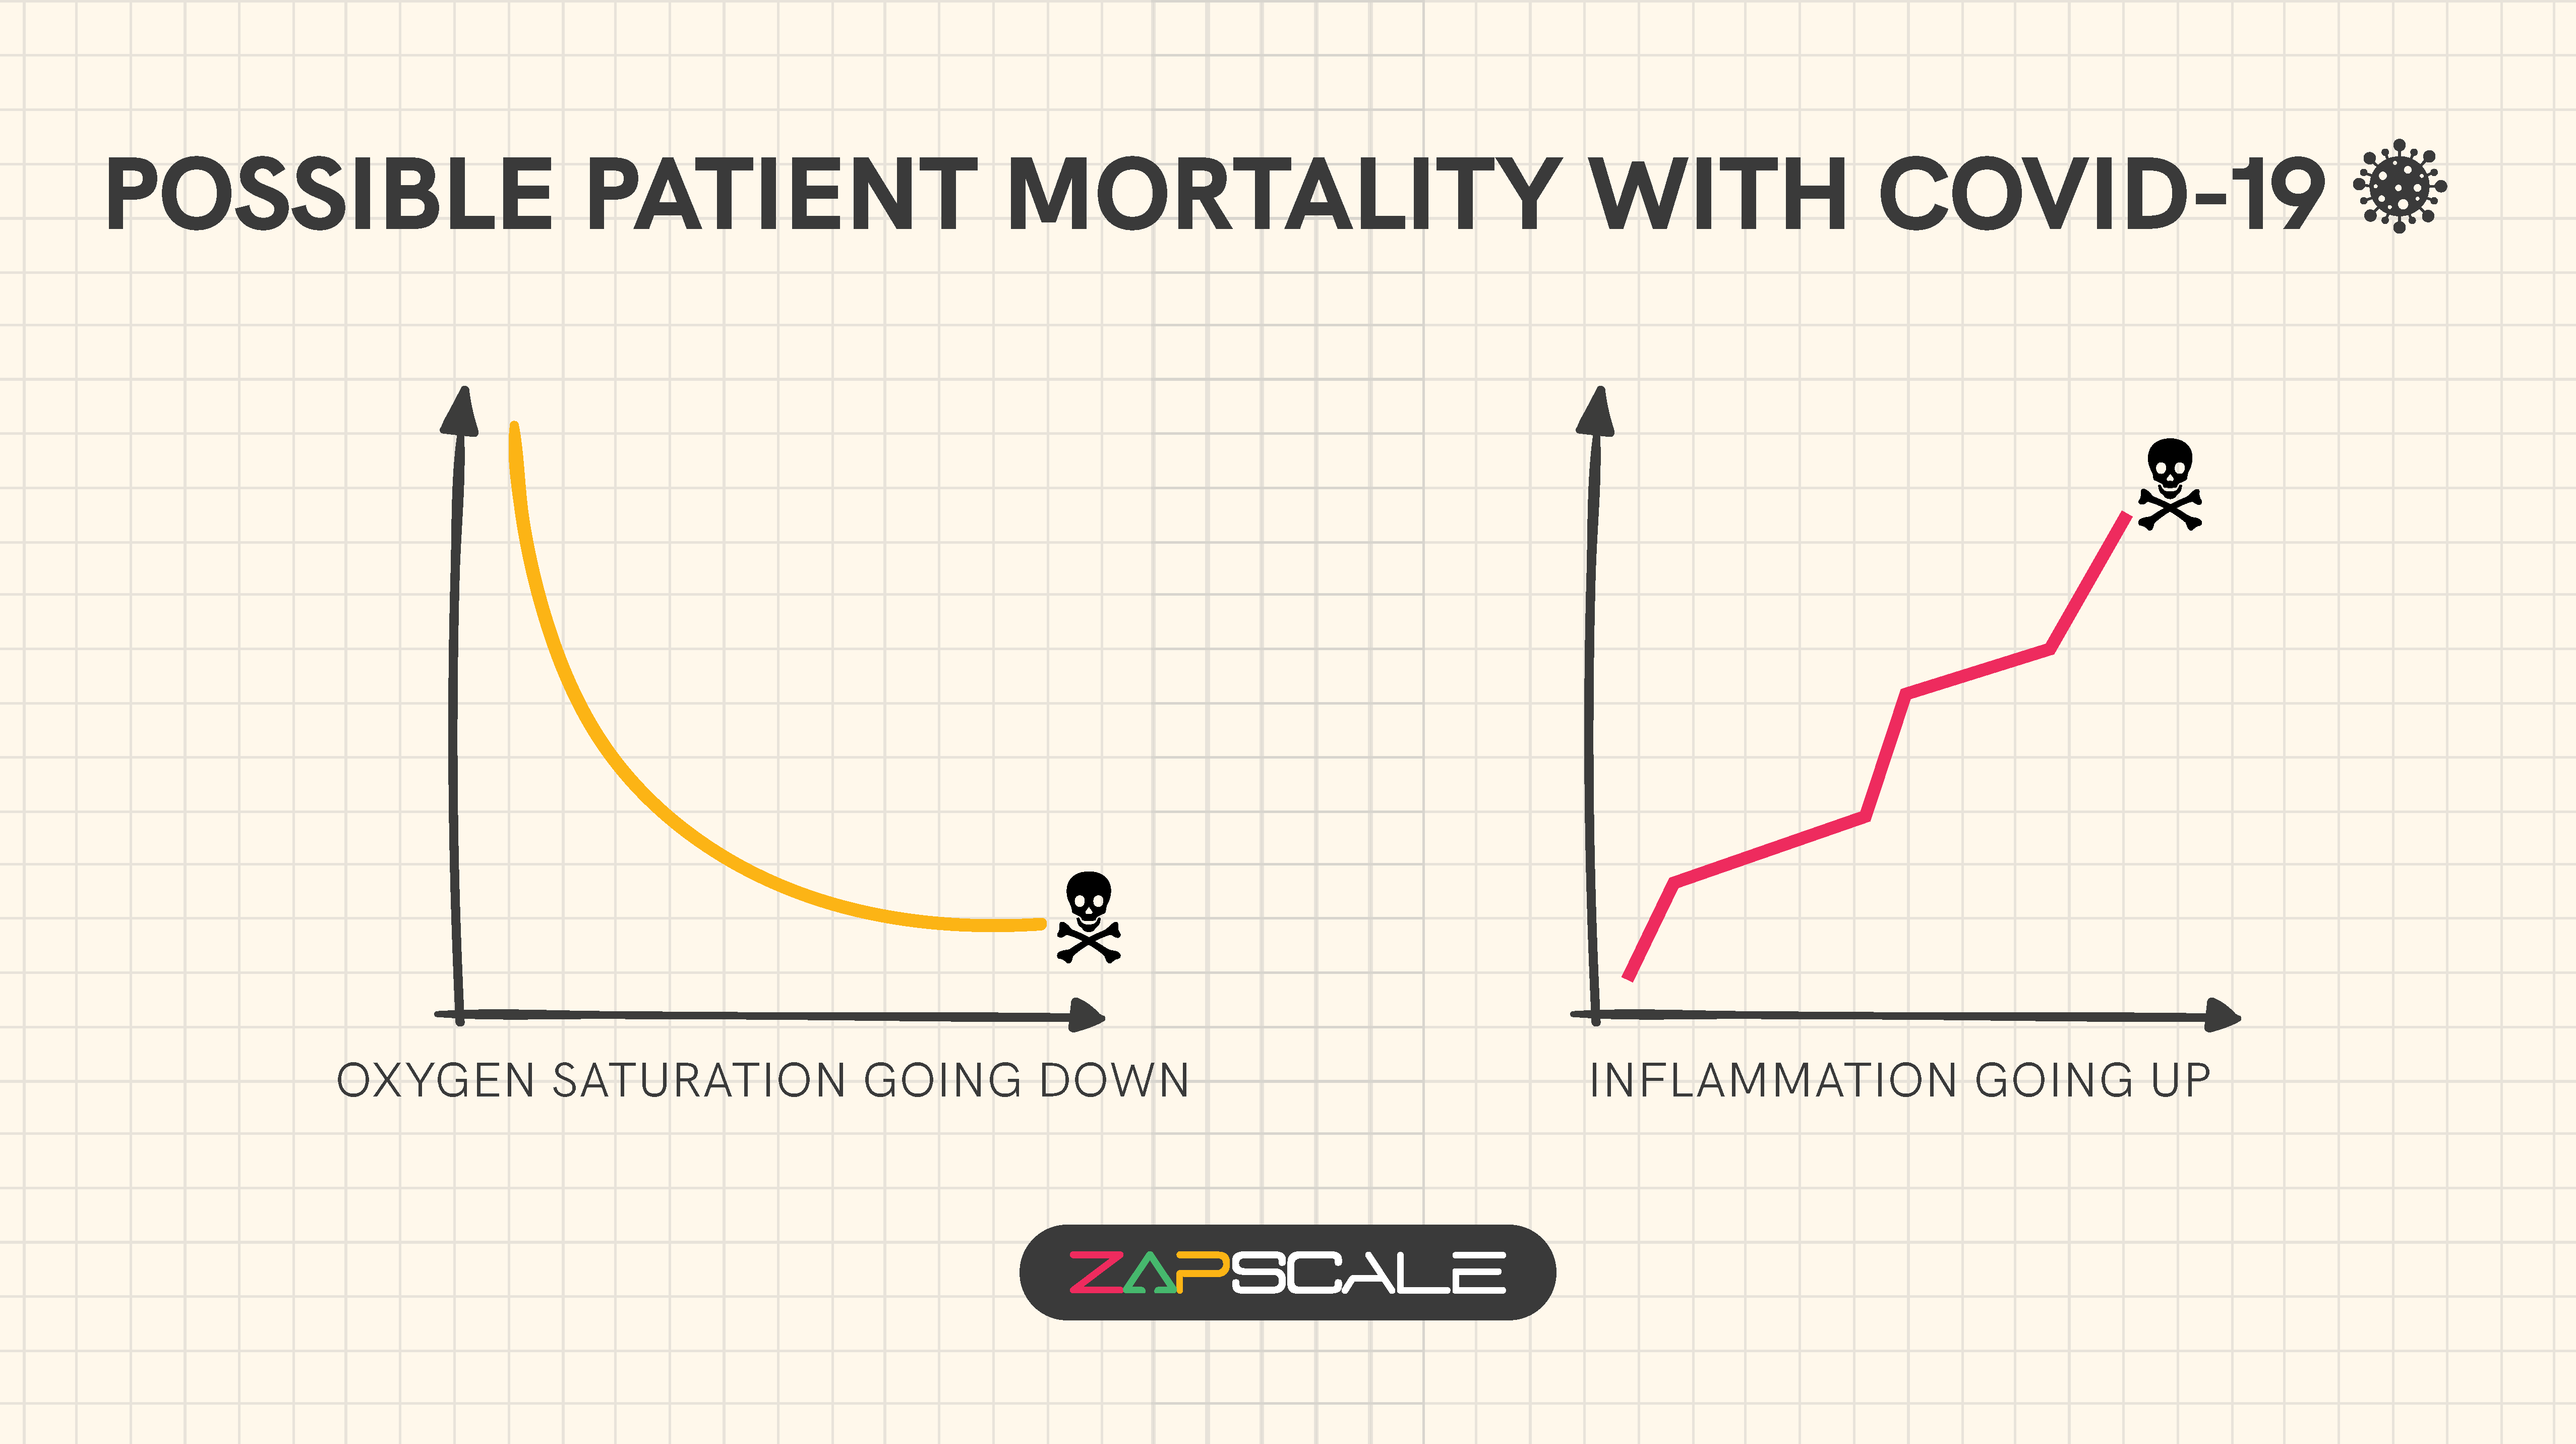
For these patients, the SPO2 will keep trending down (or will be stagnant at a very low number) AND their CRP value will keep increasing in a time series analysis (over multiple days). If such markers are observed, then the doctors can predict that the patient will die. We can plot these time series graphs, analyze them, and then decide.
Applying ARIMA For Churn Prediction With ZapScale
ZapScale applies principles from medical science's morality analysis to the B2B SaaS, using this approach to better understand customer behaviour and predict churn. We conduct a sophisticated time-series analysis of customer health, mapping it onto an N-dimensional hyperplane using machine learning models.
Let me explain this to you with an example, let’s talk about a business that has 30 customer health KPIs.
Now, think of a 30-dimensional hyperplane where all your health parameters are measured and tracked over time. If the hyperplane surface shows "trending down" or "stagnant at the bottom", then we know these are possible churn cases. We look at a minimum of 30 days' time series on an N-dimensional hyperplane to arrive at the churn probability that we simplify into 5 categories of churn probabilities - Very High, High, Mid, Low, and Very Low.
This N-dimensional hyperplane time series analysis is done by the ARIMA model, integrated into ZapScale's AI-powered analytics framework. The model is specifically trained for customer success applications to identify churn risk with precision.

Now that we’ve talked about how ZapScale assesses churn risk, it’s equally important to recognize upsell opportunities within our current customer base to foster expansion and maintain a positive NRR. ZapScale helps customer success teams pinpoint upsell-ready accounts, helping them drive growth along with retention.
How Does ZapScale Track Upselling Opportunities For B2B SaaS Businesses?
As I wrote earlier, upselling is a great way to drive revenue from the current customer base, enhance the lifetime value and foster stronger customer relationships for sustainable growth.
With its upsell score, ZapScale assesses how likely a customer is to engage in an upsell opportunity.
This score is calculated by aggregating the following KPIs:
1. Upselling Readiness (% subscribtion limited used)
This score calculates the percentage of subscription limit used. It measures how close a customer is to reaching their subscription limit, indicating upsell potential.
2. Upsell Readiness (growth % of subscription)
This score tracks the subscription growth rate. For example, a customer increasing from 10 to 20 users in a month (100% growth rate) is closer to needing an upgrade than one with no growth.
3. Upsell Tailwind (% decision-makers in good health)
This score assesses what percentage of decision-makers are in good health and hence may have an inclination toward an upsell.
4. Upsell Tailwind (% influencers in good health)
This score evaluates the health of influencers within the customer’s organization, since their support is key to a successful upsell.
So, for each customer, the upsell score is a weighted average of these metrics and is calculated daily and aggregated across various timeframes.
Conclusion
Churn and upsell are two key drivers of a positive NRR. If you’re in the SaaS business and can accurately predict customer churn and upsell opportunities, it becomes easier to monitor, forecast, and improve your net revenue retention. With ZapScale’s customer success platform, we empower CS teams to achieve greater success and make a bigger impact on the company’s revenue.

ABOUT THE AUTHOR
Popular from Artificial Intelligence
Quality Content,
Straight To Your Inbox!
Subscribe for the latest blogs, podcasts, webinars, and events!

Write a Blog
If you have experience in CS and
a flair for writing, we’d love to
feature you.
Write to us on
hello@zapscale.com
